Grafana (Kubernetes)

Grafana's Kubernetes Dashboard
Link to dashboard: https://syntheticlab.grafana.net/a/grafana-k8s-app
Grafana is an open-source observability stack that includes many tools for observability, including Grafana, Prometheus, Alloy, Loki etc.
Grafana provides a convenient zero-config helm chart that provides many monitoring basics, which then feed into a dashboard hosted by Grafana Cloud.
The monitoring apps run in our Kubernetes cluster in the grafana-cloud namespace.
Using the Dashboard
Go to https://syntheticlab.grafana.net and click Kubernetes on the left sidebar.
I recommend filtering the namespace dropdown to default (as pictured above), as that is where our Synthetic workloads run.
Reading logs
-
Click on
Workloadsin the left sidebar.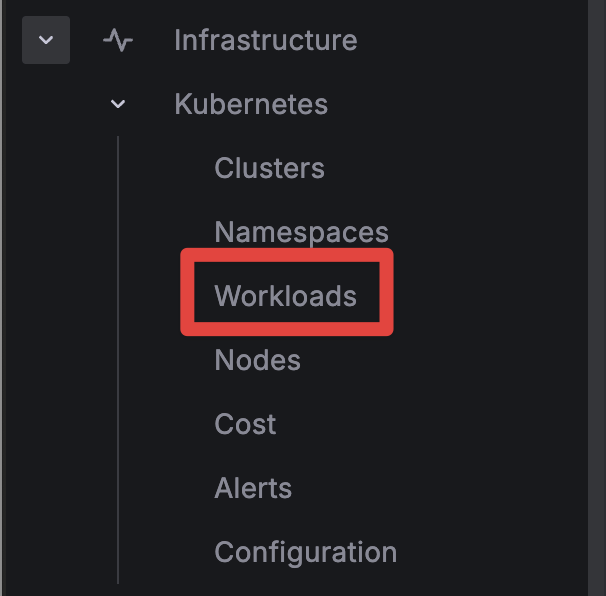
-
(Optional) Filter by the
defaultnamespace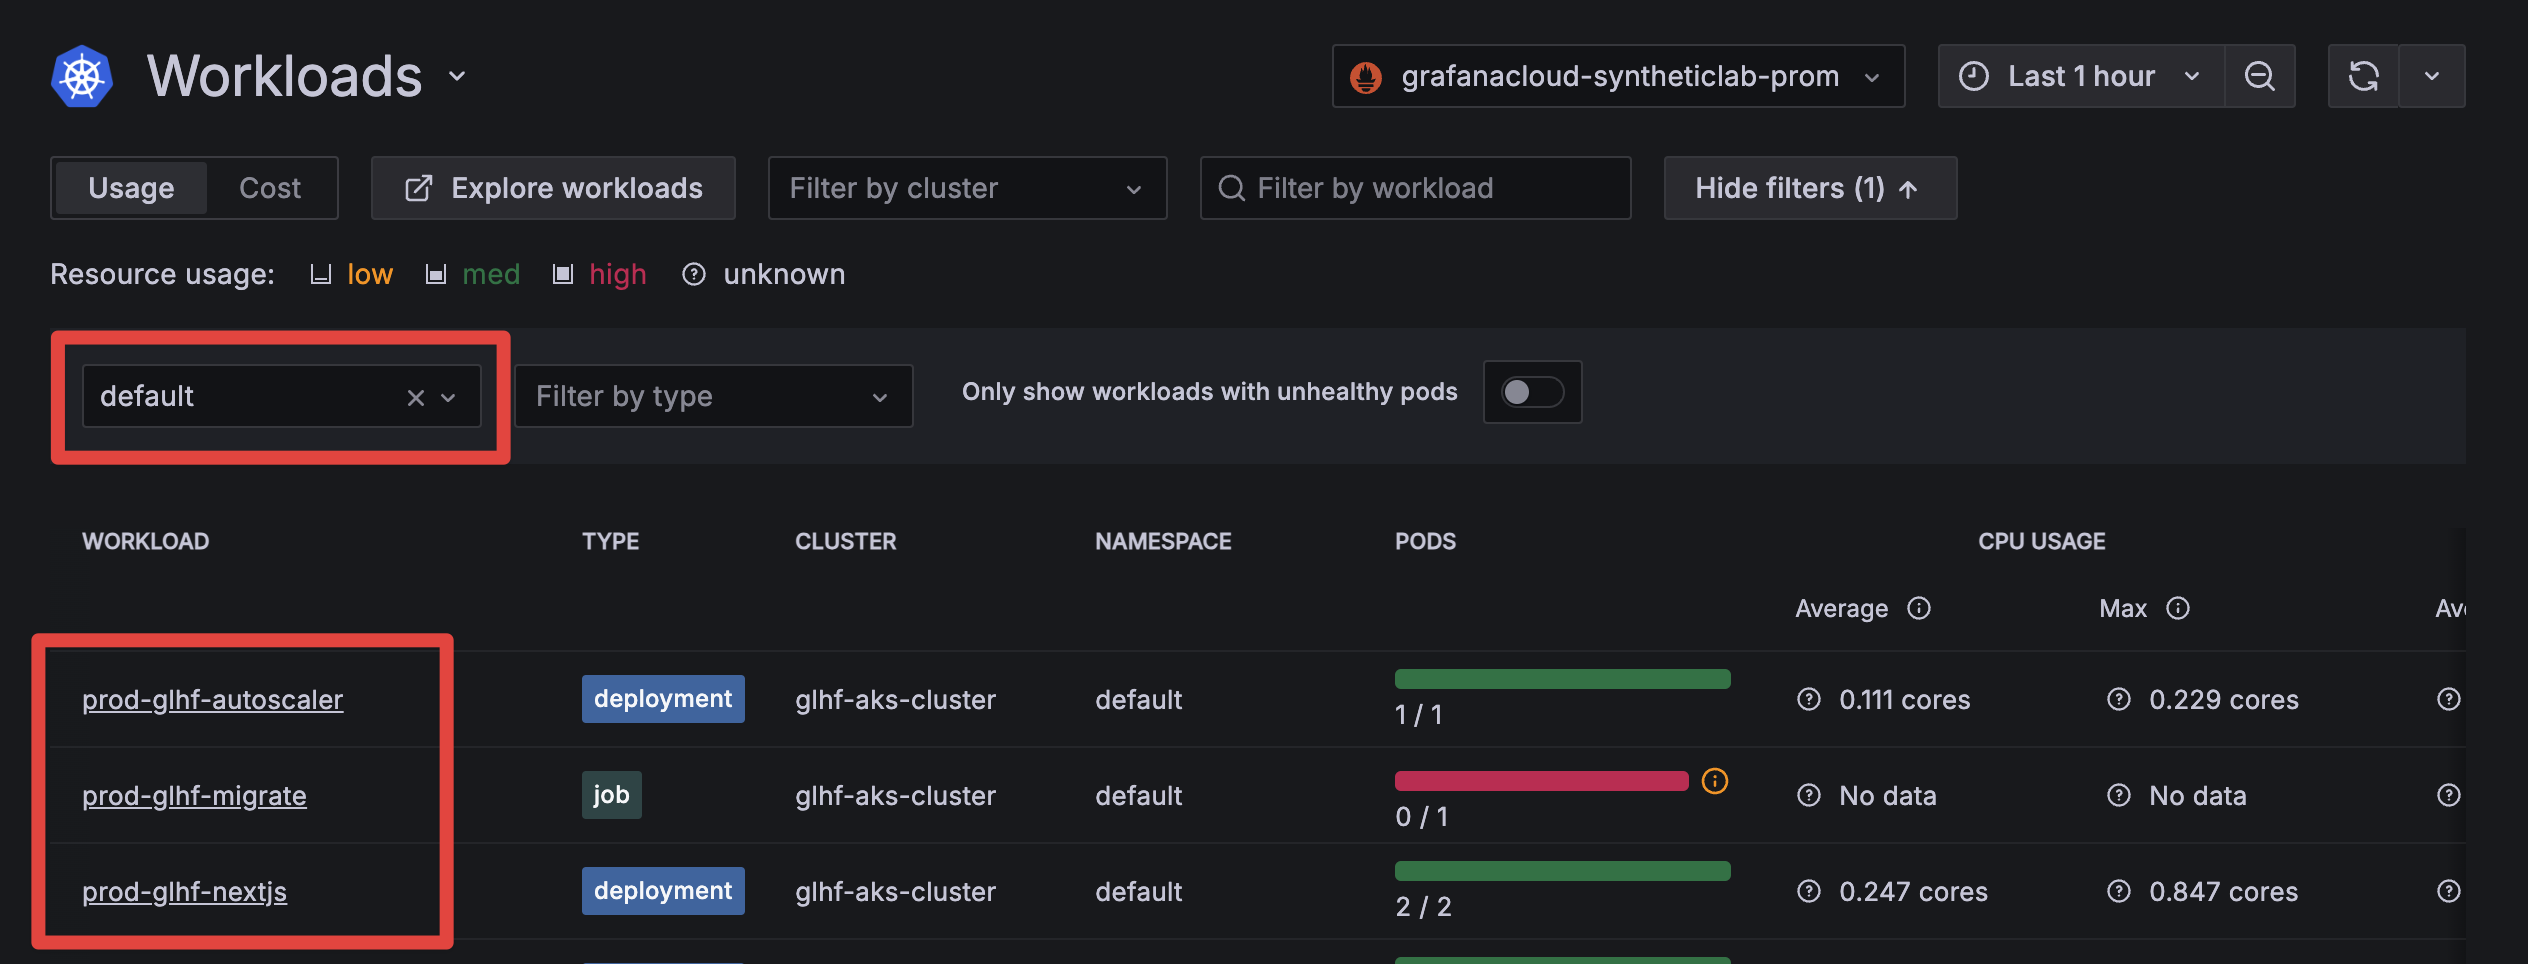
-
Click on the workload you'd like to inspect.
-
Click on
Logs & Events.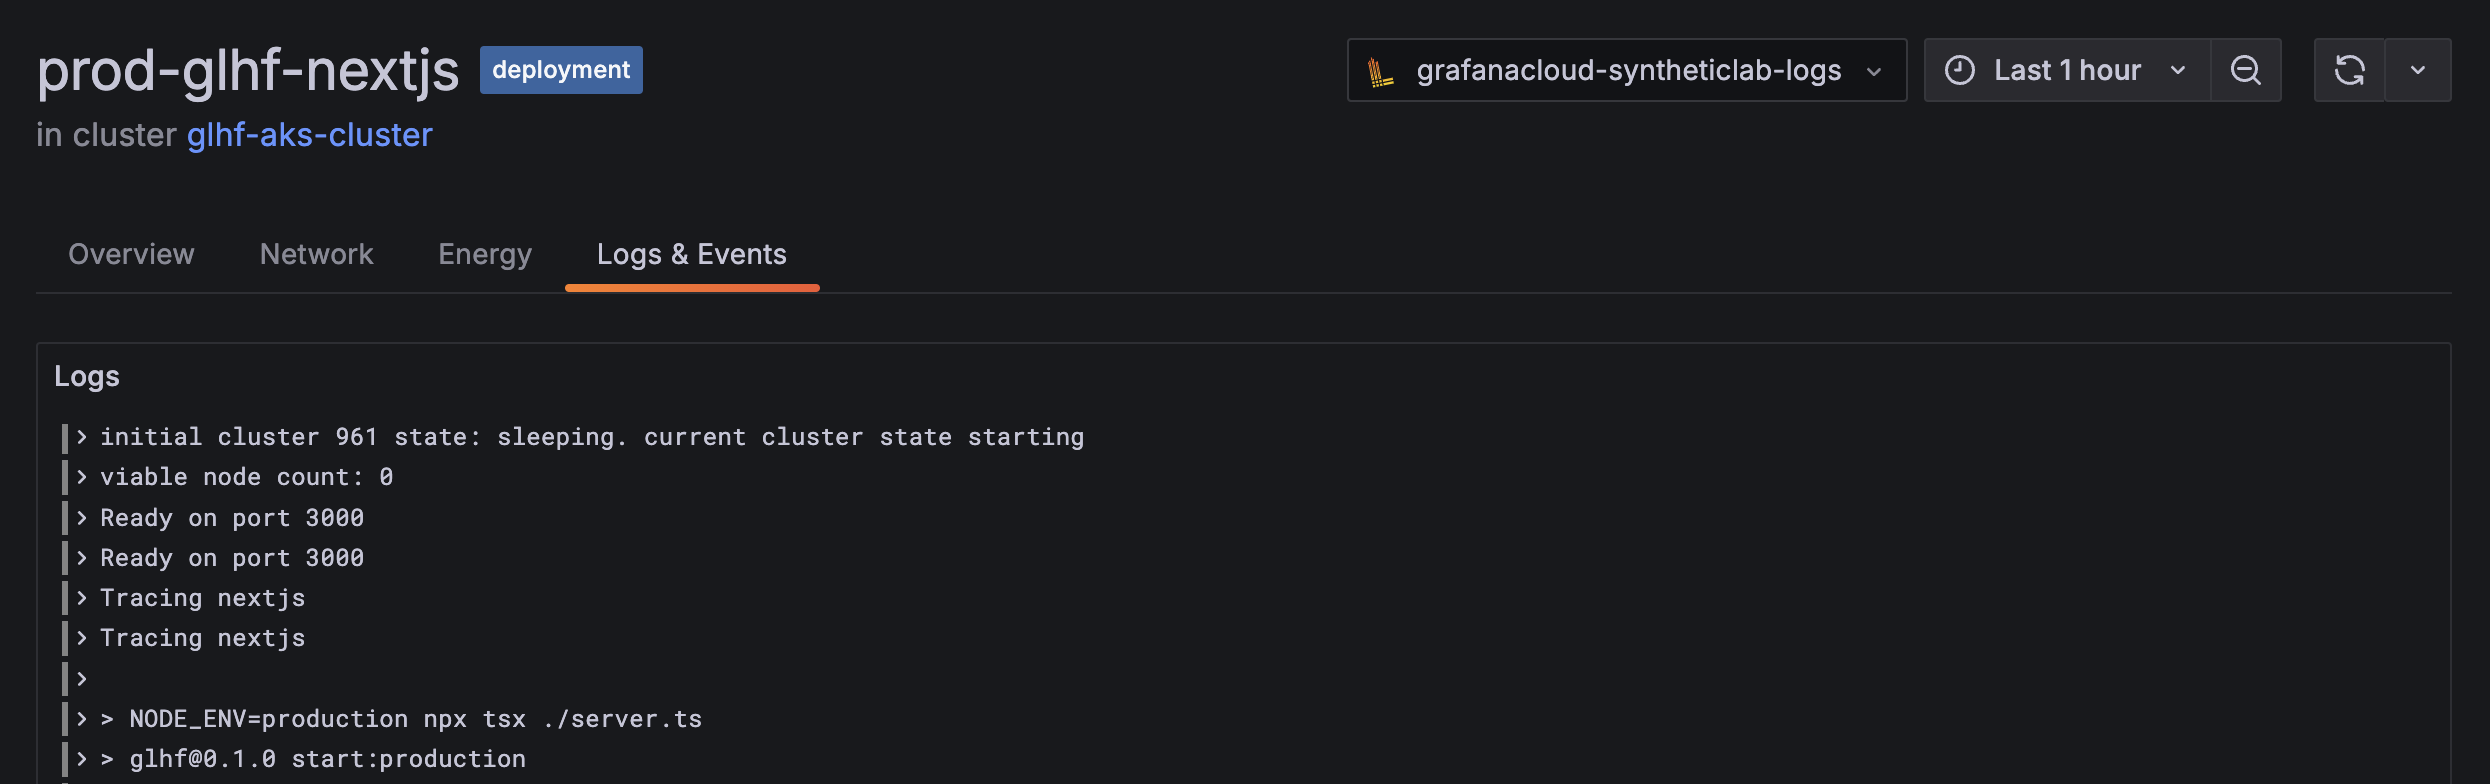
Modifying The Helm Chart
-
Modify
_infra/k8s/helm/grafana-k8s/values.yaml. -
Check expected diffs
helmfile diff -
Apply changes
helmfile apply