Grafana Alerts
We currently use Grafana's zero-config out-of-the-box Kubernetes monitoring solution.
See Grafana (Kubernetes).
This comes with several sane default alerts configured by Grafana, eg. for CPU/Memory usage and crash loops.
Viewing/Editing Alerts
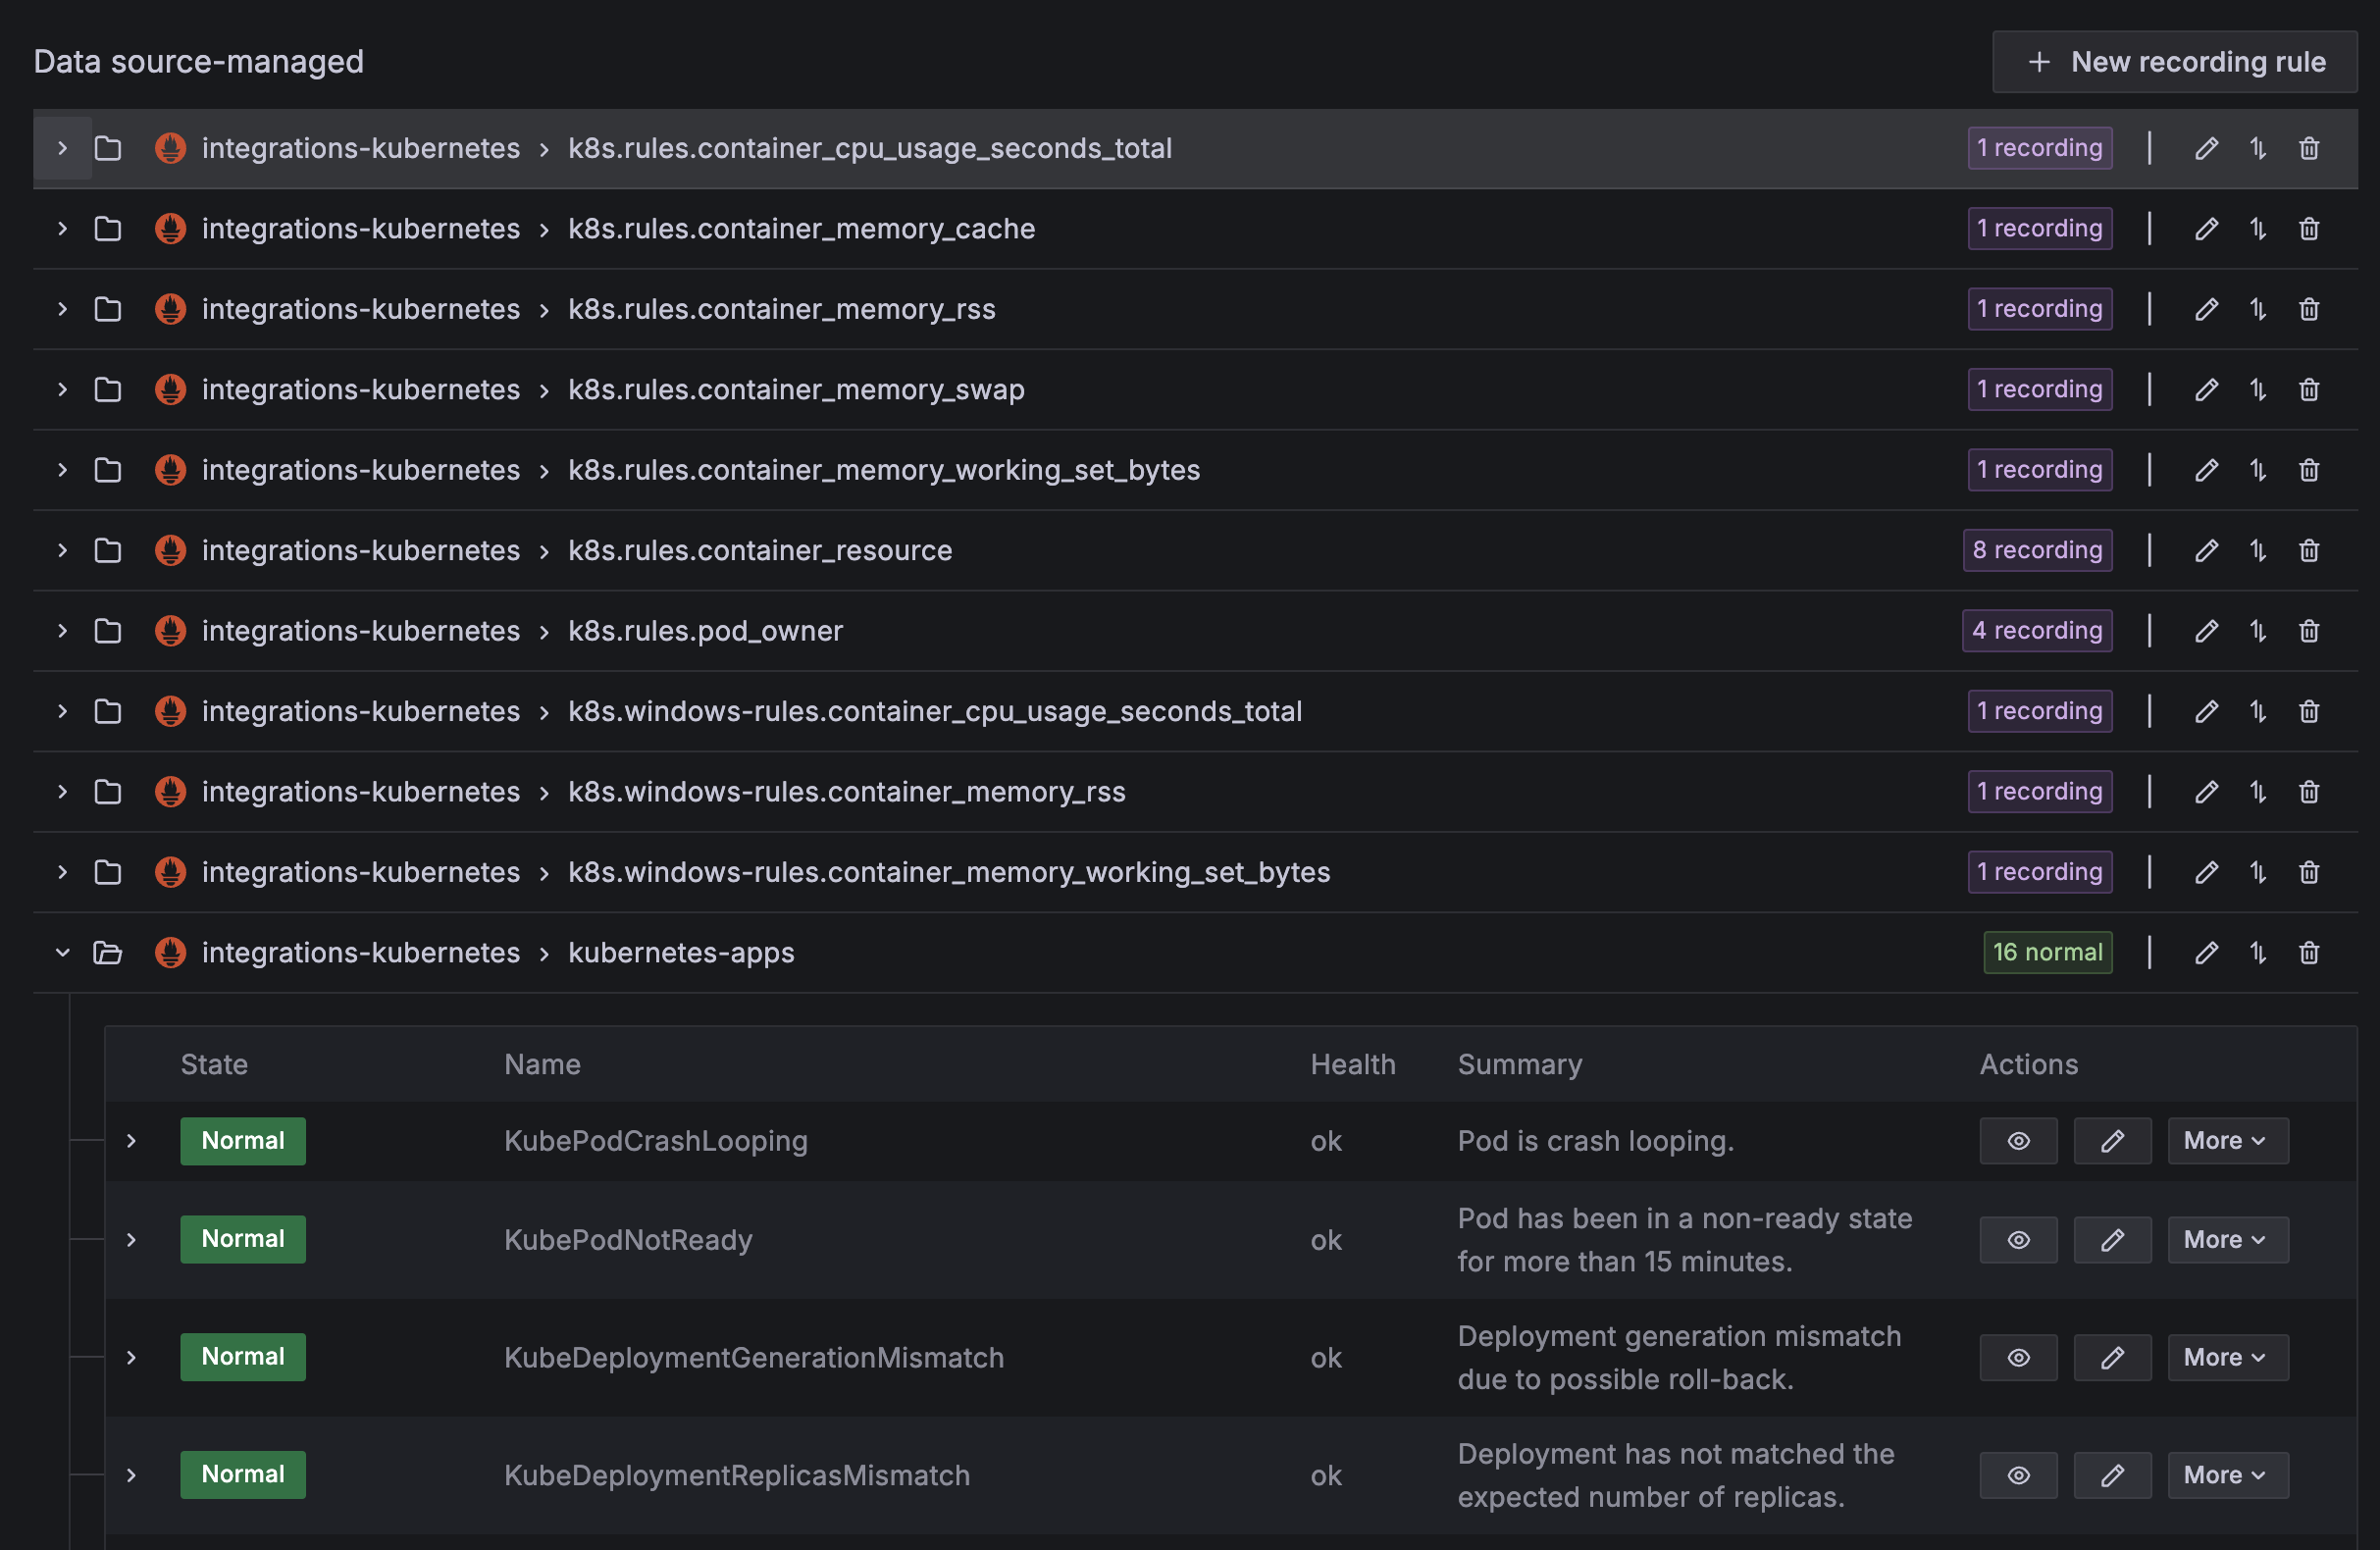
Default Grafana Alerts for Kubernetes
Alerts can be viewed by going to the Grafana Dashboard and clicking on Alerting > Alert rules.
Alerts can also be edited on this page. By default, these alert rules are created and managed by Grafana.
Alert Notifications
Alert notifications can be edited by going to the Contact points and Notification policies pages.
warning
Make sure the non-default Alertmanager created by the Grafana Kubernetes integration is selected as shown below.
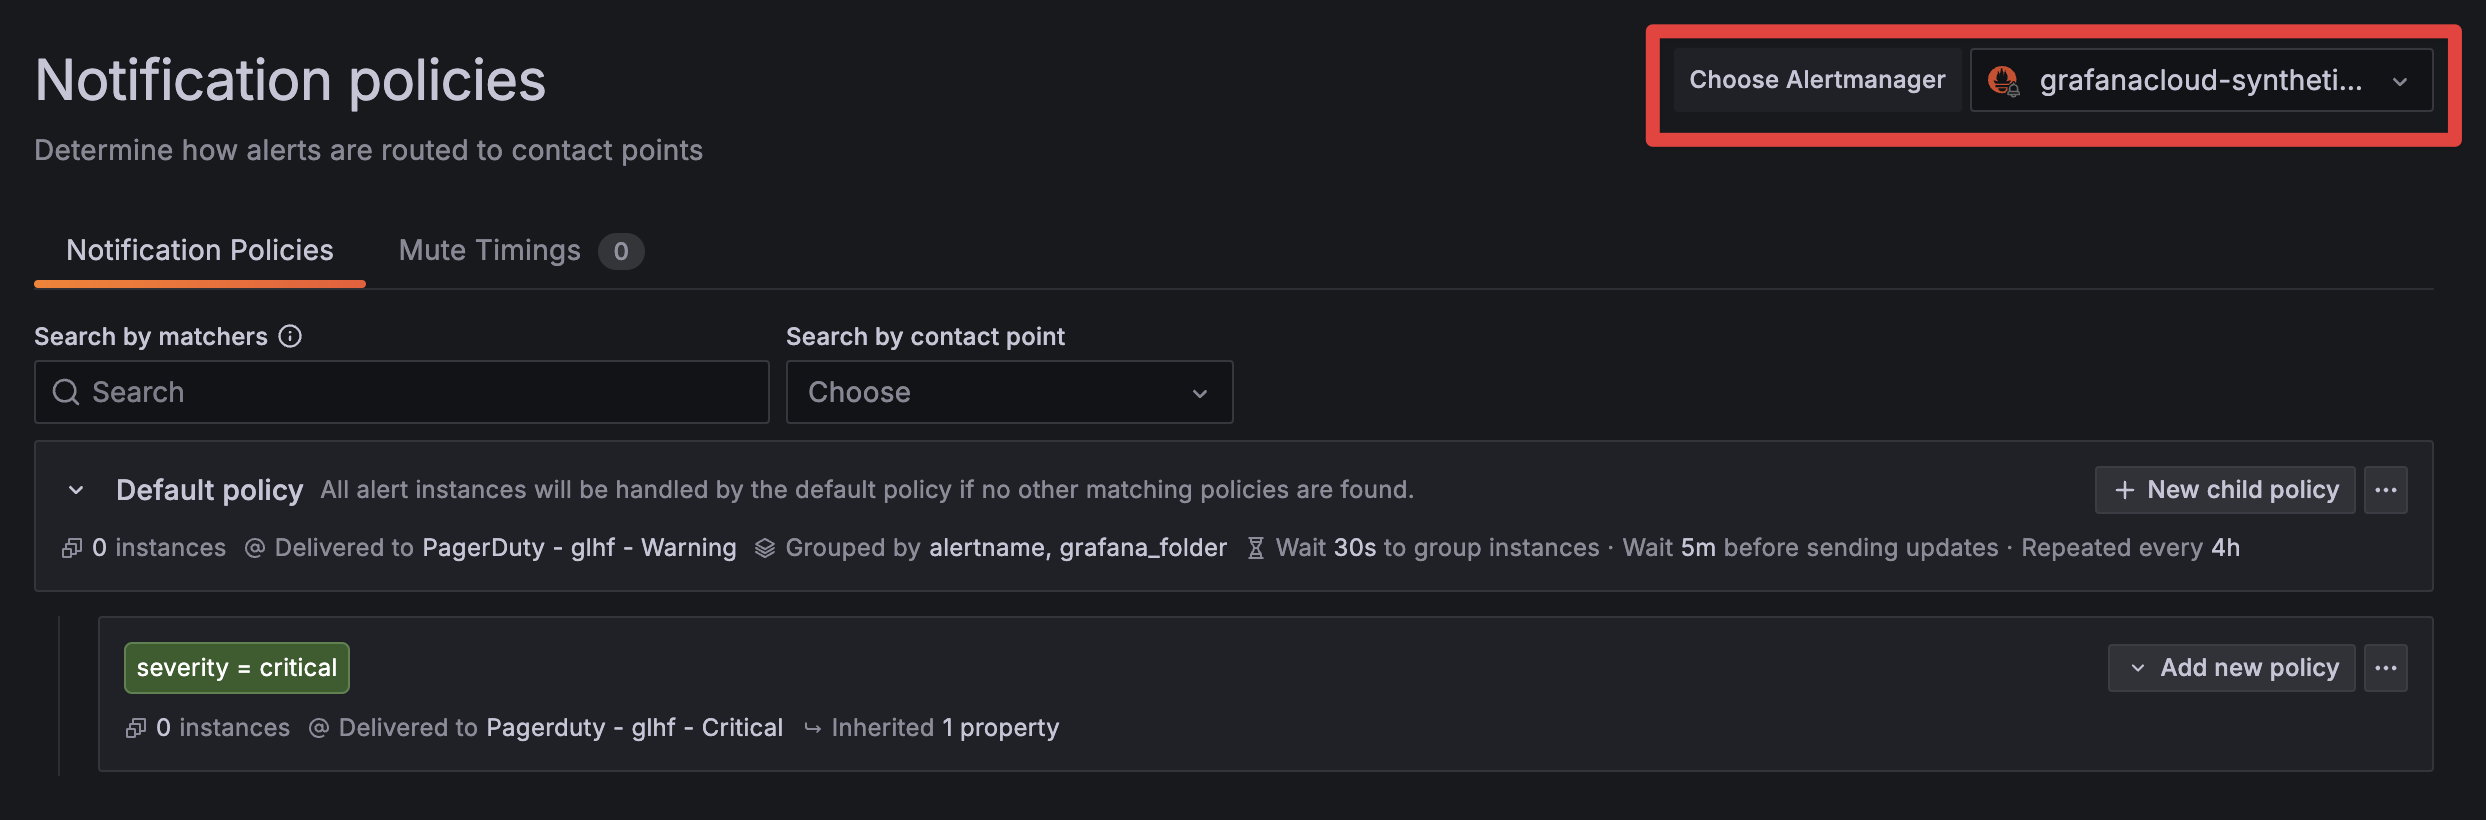
Notification Policies